


But once institutional capital enters at Series A, the conversation changes.
Investors stop asking:
“How fast are you growing?”
They start asking:
“How much recurring revenue are you retaining?”
At this stage, SaaS retention metrics become the foundation of valuation, capital efficiency, and long-term scalability.
Two metrics matter most:
-
Gross Revenue Retention (GRR)
-
Net Revenue Retention (NRR)
If your revenue bucket is leaking, no amount of customer acquisition can create efficient ARR growth.
To build a compounding SaaS growth engine, you must master both.
Why 120% NRR Is the “Holy Grail” for Series A Founders
In SaaS economics, 120%+ Net Revenue Retention is considered elite.
Why?
Because it means your business grows without new customers.
1. Compounding ARR Growth
If you begin the year with $10M in Annual Recurring Revenue (ARR) and your NRR is 120%, then:
-
Year-end ARR from existing customers = $12M
-
$2M in expansion revenue without new logo acquisition
Extend that over three years:
Year ARR at 120% NRR 0 $10.0M 1 $12.0M 2 $14.4M 3 $17.3M 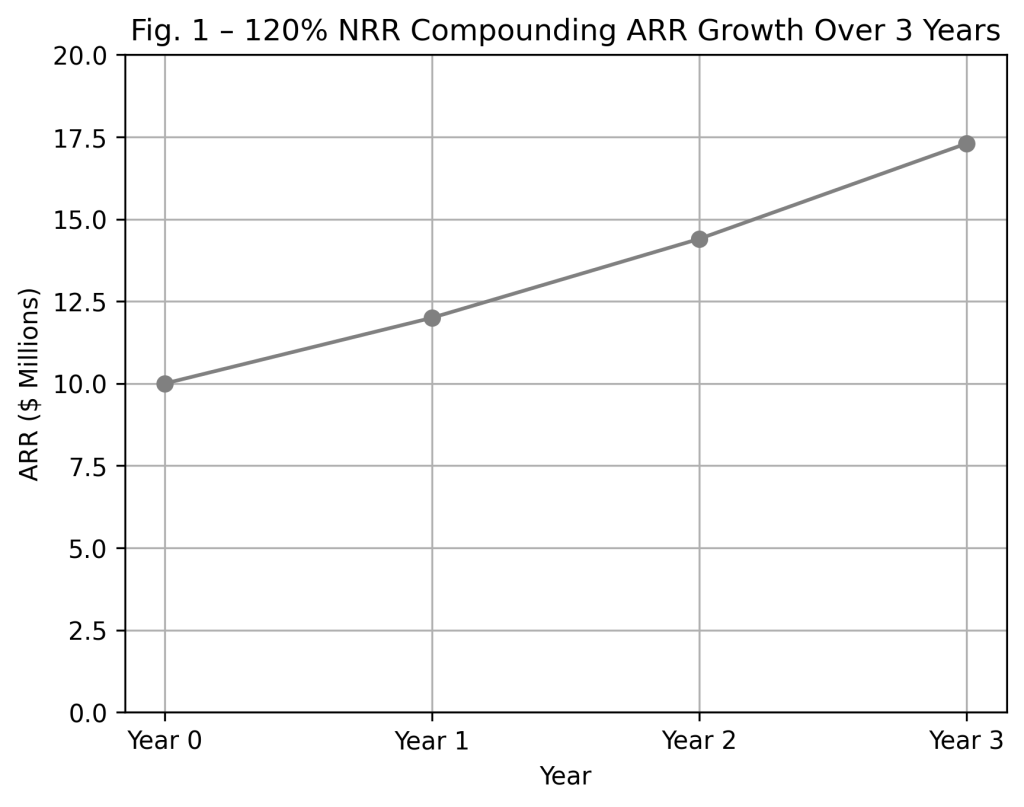
That is 73% growth from retention alone.
This is why NRR is often called the “compounding engine” of SaaS.
2. 30–50% Reduction in Customer Acquisition Pressure
Strong revenue retention reduces reliance on:
-
Paid acquisition
-
Outbound sales
-
Heavy CAC investment
When expansion revenue drives growth, companies often reduce acquisition pressure by 30–50%.
This improves:
-
LTV/CAC ratio
-
CAC payback period
-
Burn multiple
-
Capital efficiency
Retention directly impacts your SaaS valuation multiple.
3. Premium SaaS Valuation Multiples
Public SaaS data consistently shows that companies with:
-
120%+ NRR
-
90–95%+ GRR
-
Low SaaS churn rate
Command materially higher revenue multiples.
Investors reward predictability.
Retention equals predictability.
Understanding the Difference Between NRR and GRR
What Is Gross Revenue Retention (GRR)?
Gross Revenue Retention (GRR) measures the percentage of recurring revenue retained from existing customers over a given period – excluding expansion revenue.
It accounts only for:
-
Customer churn
-
Revenue contraction
-
Downgrades
GRR Formula:

Example
Starting ARR: $10M
Churn: $600K
Contraction: $400K
GRR = (10M − 1M) / 10M
GRR = 90%
What GRR Tells You
GRR answers one question:
How leaky is your revenue bucket?
Healthy GRR Benchmarks
-
SMB SaaS: 85–90%
-
Mid-Market SaaS: 90–95%
-
Enterprise SaaS: 95%+
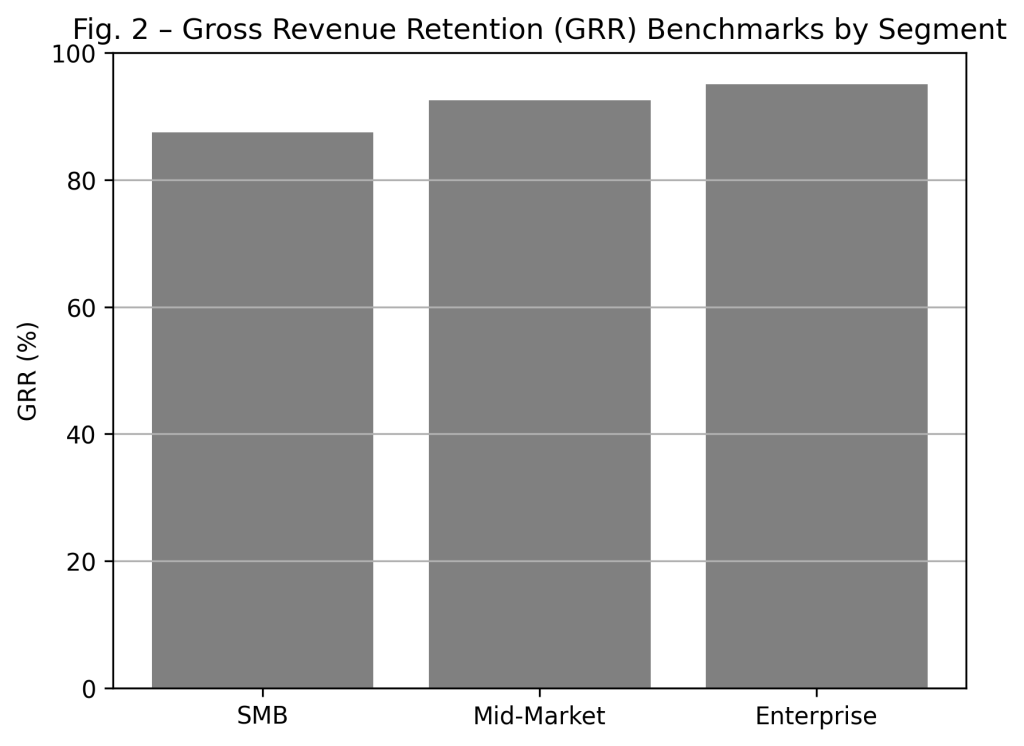
If your SaaS churn rate drives GRR below 85%, your sales team is replacing revenue instead of generating net growth.
That is inefficient scaling.
What Is Net Revenue Retention (NRR)?
Net Revenue Retention (NRR) measures total recurring revenue retained plus expansion revenue from existing customers.
It includes:
-
Churn
-
Contraction
-
Upsells
-
Cross-sells
-
Seat growth
-
Usage-based expansion
NRR Formula:

Example
Starting ARR: $10M
Churn: $600K
Contraction: $400K
Expansion Revenue: $2.5M
NRR = (10M − 1M + 2.5M) / 10M
NRR = 115%
What NRR Tells You
NRR answers:
Are your existing customers expanding faster than they are churning?
Series A NRR Benchmarks
-
Below 100% → Negative retention (shrinking ARR)
-
100–110% → Stable SaaS retention
-
110–120% → Strong revenue retention
-
120–130%+ → Elite compounding growth
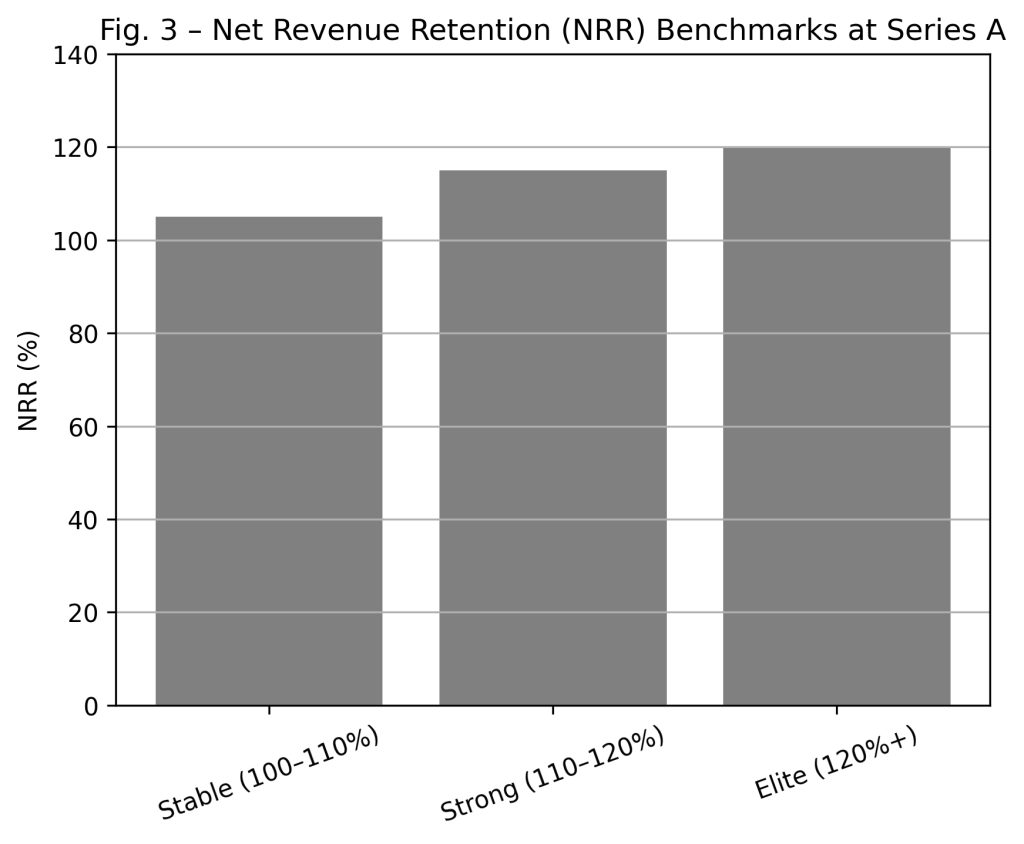
Strong Series A SaaS companies typically land between 110–130%+ NRR.
The “False Growth” Trap
High NRR alone can be deceptive.
Consider:
-
NRR = 120%
-
GRR = 75%
This means expansion revenue is masking significant churn.
If upsell momentum slows, revenue collapses.
Sustainable SaaS growth requires:
-
GRR above 90%
-
NRR above 110%
Stability first. Expansion second.
The 7-Step Framework to Improve SaaS Retention
Retention is not just a Customer Success KPI.
It is a cross-functional strategy involving:
-
Product
-
Sales
-
Pricing
-
Onboarding
-
Customer Success
Step 1: Implement Cohort-Based Tracking
Aggregate retention metrics hide structural issues.
Segment retention by:
-
Ideal Customer Profile (ICP)
-
Industry vertical
-
Deal size
-
Acquisition channel
Companies using cohort analysis improve retention intervention effectiveness by 20–30%.
 Visual Idea: 12-month ARR retention curve by ICP.
Step 2: Diagnose SaaS Churn Drivers
Before pursuing expansion revenue, fix churn.
Categorize churn into:
-
Product-market misalignment (35–45%)
-
Onboarding failure (20–30%)
-
Budget constraints (15–25%)
-
Competitive displacement (10–20%)
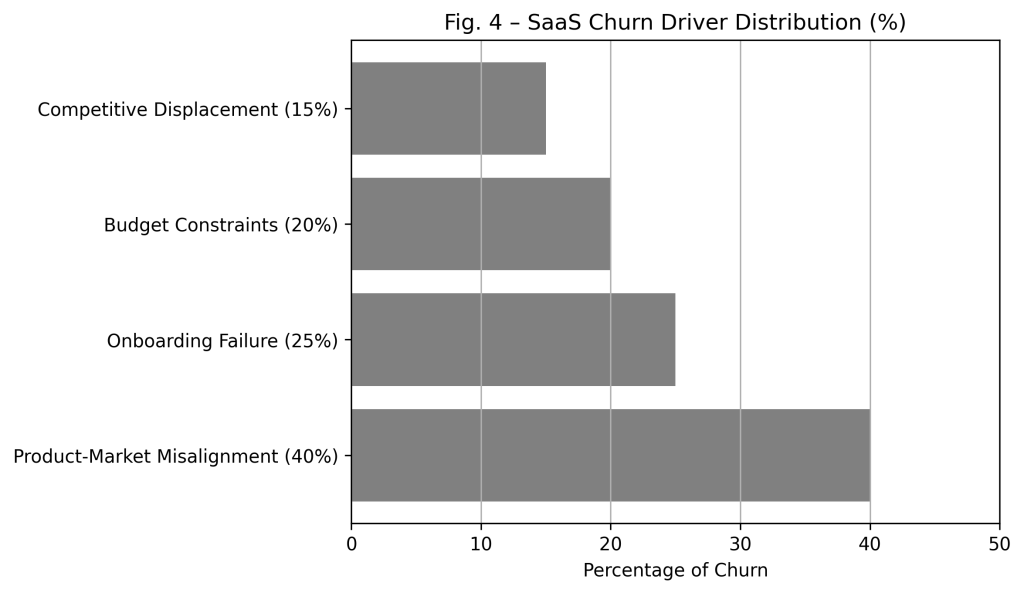
Quantify revenue impact per category.
Visual Idea: Pie chart of churn rate distribution.
Step 3: Enforce ICP Discipline
Retention begins at the point of sale.
Identify segments with:
-
GRR above 95%
-
NRR above 120%
Tightening sales qualification rules can improve GRR by 5–15 percentage points within 12 months.
Step 4: Optimize Time-to-Value (TTV)
Long-term revenue retention is often decided within the first 30–60 days.
Customers who fail to reach “First Value” churn at materially higher rates.
Reducing Time-to-Value can improve retention by up to 25%.
Visual Idea: Retention probability vs. onboarding milestone completion.
Step 5: Build Systematic Expansion Triggers
Elite NRR is not accidental.
Define measurable expansion triggers:
-
Usage thresholds
-
Seat growth milestones
-
Feature adoption signals
-
Account maturity stages
Companies with structured expansion playbooks are 2x more likely to achieve 120%+ NRR.
Step 6: Align Pricing With Value Scaling
Flat pricing limits expansion revenue.
Adopt scalable pricing models:
-
Per-seat pricing
-
Usage-based pricing
-
Tiered feature bundles
-
Add-on monetization
Revenue growth must align with customer value creation.
Step 7: Practice Radical Board Transparency
Retention metrics belong in every Series A board deck.
Report:
-
Gross Revenue Retention (GRR)
-
Net Revenue Retention (NRR)
-
SaaS churn rate
-
Cohort trends
-
Expansion revenue contribution to ARR
Transparency builds investor trust and protects valuation multiples during difficult quarters.
Key Benchmarks: What “Healthy” Looks Like at Series A
If preparing for a fundraise or board review, target:
| Metric | Series A Benchmark |
|---|---|
| Gross Revenue Retention (GRR) | 90–95%+ |
| Net Revenue Retention (NRR) | 110–130%+ |
| SaaS Churn Rate | <10% annually (mid-market target) |
| Expansion Revenue Contribution | Meaningful % of ARR |
| Cohort Visibility | Quarterly segmented reporting |
When these metrics align:
-
ARR growth compounds internally
-
Customer acquisition cost pressure decreases
-
Revenue predictability improves
-
Capital efficiency strengthens
-
SaaS valuation multiples expand
Final Takeaway
Gross Revenue Retention stabilizes your foundation.
Net Revenue Retention compounds your growth.
In Series A SaaS, growth fueled purely by new logos is fragile.
Growth fueled by revenue retention is durable, capital-efficient, and investor-grade.
If your revenue bucket is leaking, do not simply pour more acquisition spend into it.
Fix the leaks.
Then, engineer expansion into your operating system.
By: Allen Van Natter, CEO & Founder, Van Natter Consulting Group
 Book a Free Strategy Call with Van Natter Consulting Group