


Early-stage startup founders often wonder how to impress investors beyond just having a great idea. The answer is simple: show them the numbers. In fact, only about 1% of pitch decks succeed in raising funds, so you need every advantage you can get. Investors are busy, and they’ll spend only a few minutes on your deck, often laser-focused on your financial metrics. To stand out, you must turn your revenue metrics into a compelling story – one that proves your venture’s traction, growth, and potential. This guide will walk you through key revenue metrics to highlight and how to present them in an investor-friendly way. By the end, you’ll know how to use data as your secret weapon in crafting a winning investor pitch.
Why Revenue Metrics Matter to Investors
Investors love data. Sure, they care about your vision and team, but when it comes to evaluating a startup, traction speaks louder than words. Traction usually means revenue and growth – concrete evidence that your business is gaining momentum. Research shows that for many investors, financial slides are the most important part of a pitch deck, receiving the greatest attention. In particular, income (revenue) is the #1 metric they look for, mentioned in 35.8% of expert recommendations – more than any other financial data point.
In one analysis of 25 expert opinions on pitch deck financials, revenue (income) metrics were the most-cited element, making up about 36% of recommendations. By contrast, profitability was only ~10%, indicating that at early stages investors prioritize growth and revenue potential over current profits.
It’s not just about having revenue – it’s about telling the story behind the numbers. Investors value growth and market opportunity highly (one survey found market size was 28% of their consideration and growth potential 19%). They want to see that your revenue is growing quickly and that it can scale in a big market.
Key Revenue Metrics to Highlight in Your Pitch
1. Recurring Revenue (MRR/ARR)
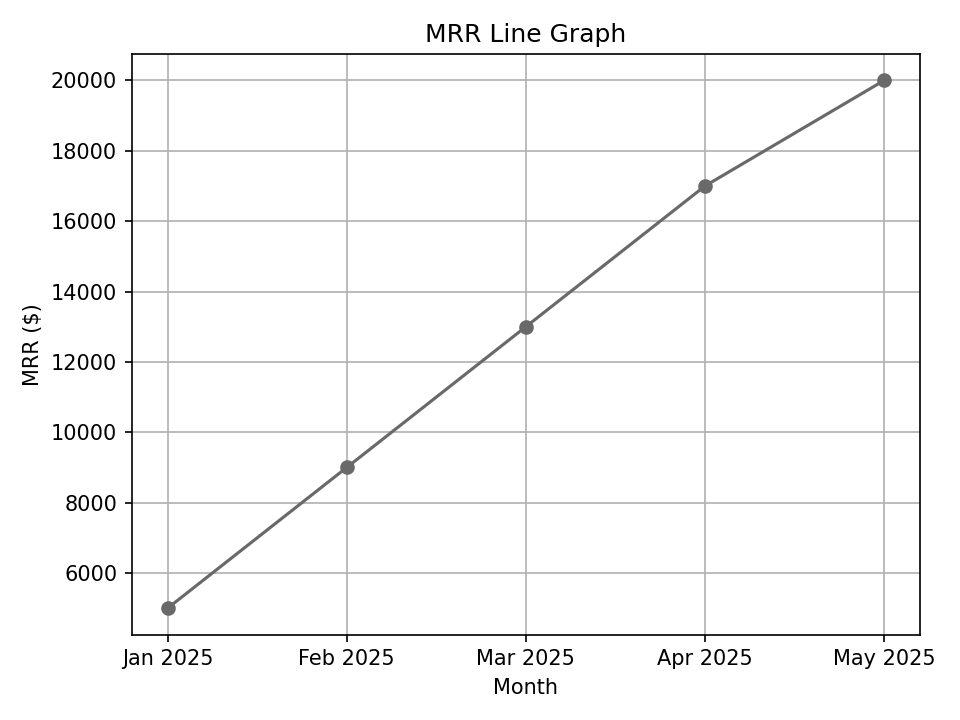
- Highlight Monthly Recurring Revenue (MRR) or Annual Recurring Revenue (ARR) if you operate a SaaS or subscription model.
- For example: “Our MRR grew from $5K to $20K in six months, indicating rapid customer adoption.”
2. Revenue Growth Rate
- Show month-over-month (MoM) or year-over-year (YoY) growth.
- A 15-20% MoM growth rate is considered healthy; at 20% MoM, revenue 10x’s in a year.
3. Customer Acquisition Cost (CAC) vs. Lifetime Value (LTV)
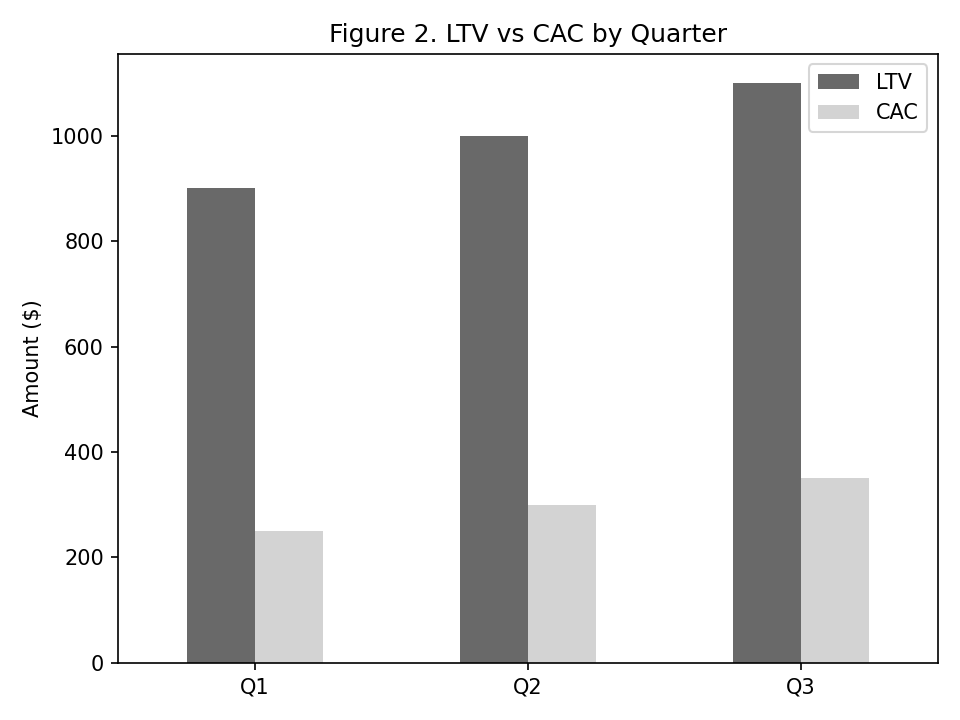
- Strong businesses have a LTV:CAC ratio of 3:1 or better.
- Example: “Our CAC is $250, while our LTV is $900, yielding a 3.6:1 ratio.”
4. Net Dollar Retention (NDR)
- Measures upsells, expansions, and churn in one metric. Anything over 100% is great, and 120%+ is best-in-class.
- “Our NDR is 127%, indicating existing customers are expanding their contracts.”
5. Burn Multiple
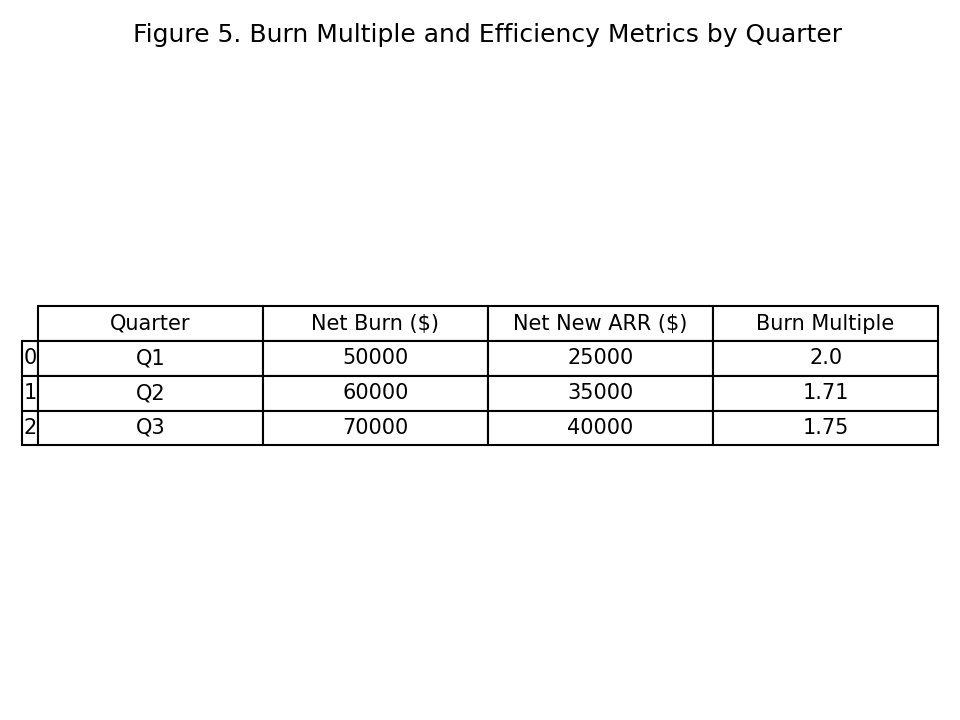
- Burn multiple = Net burn / Net new ARR. It shows efficiency.
- Seed-stage startups typically aim for a burn multiple under 2.0.
6. Cohort Retention
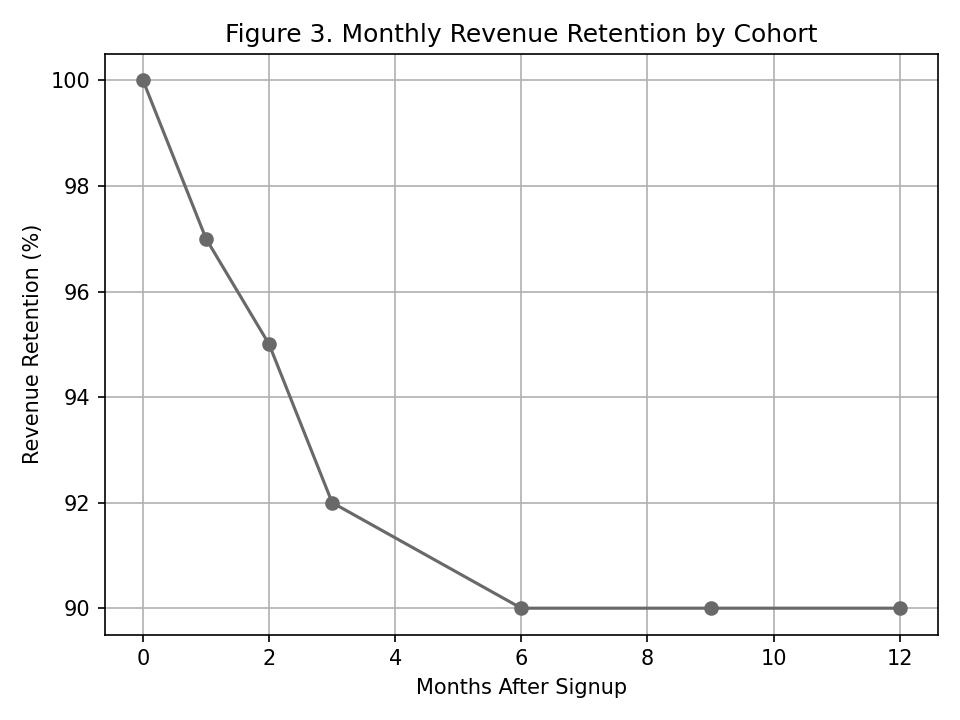
- Visualizing cohorts shows how different customer groups behave over time.
- “Our Q1 cohort retained 90% of its revenue after 12 months.”
Benchmarks: How Do Your Numbers Stack Up?
Traction expectations rise at each stage.
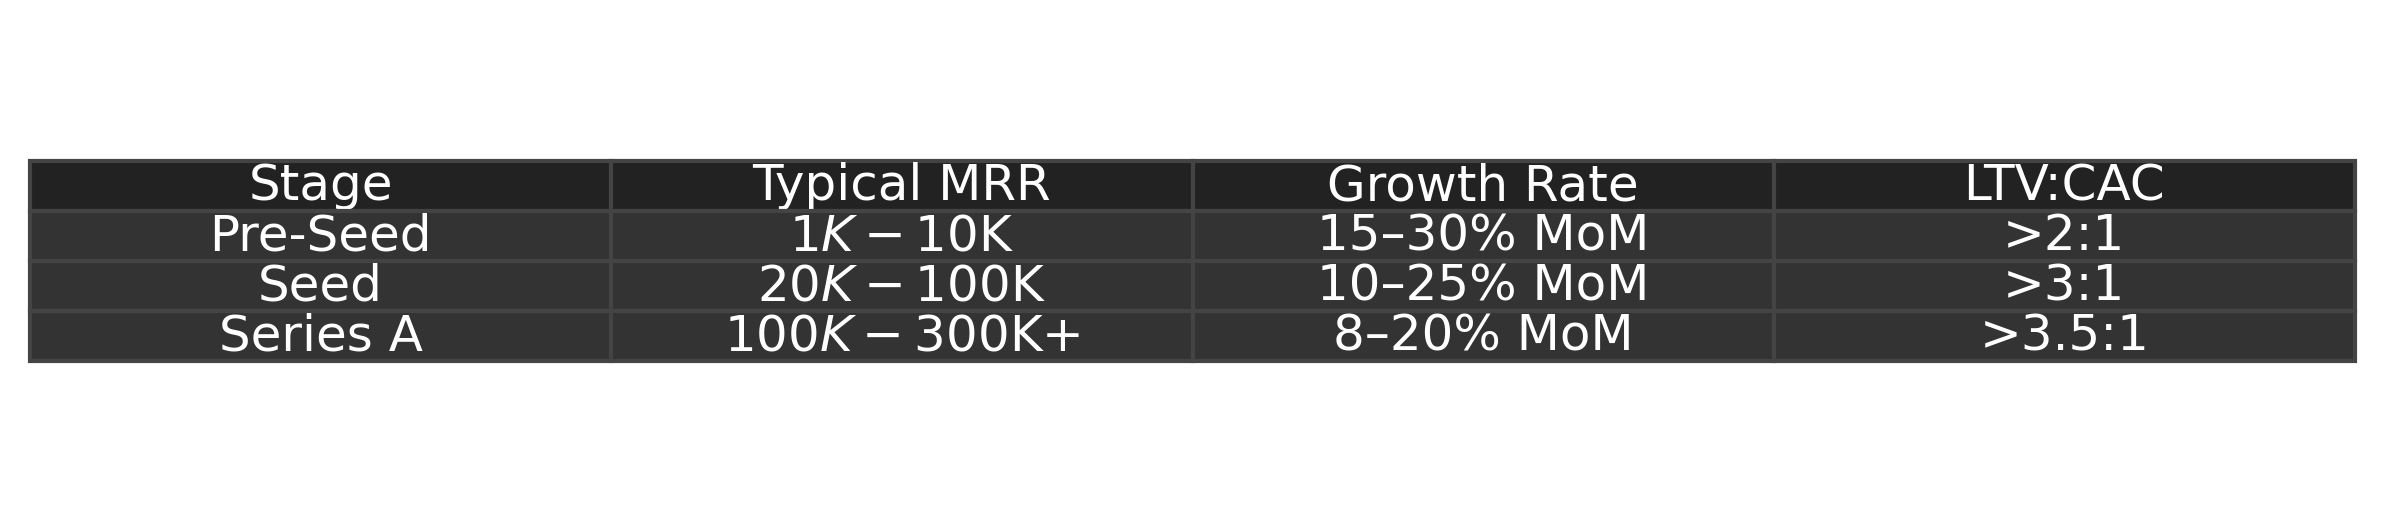 Use these benchmarks to guide your narrative. If your metrics are above average, emphasize that.
How to Present Revenue Metrics to Investors
Once you’ve identified your strongest revenue metrics, presentation matters just as much as performance. Investors appreciate clarity, honesty, and the ability to connect data to your growth narrative.
Here’s how to effectively present your metrics:
- Use visuals. Line graphs, bar charts, and simple tables communicate faster.
- Tell the story. Link milestones to revenue changes (e.g., “Launched v2.0 → ARR tripled”).
- Contextualize. Compare to peers, highlight how you beat industry averages.
- Stay honest. Don’t inflate projections or cherry-pick metrics. Transparency builds trust.
- Show trends. Metrics over time are more powerful than snapshots.
Visual Examples That Strengthen Investor Pitches
To support your narrative, consider including these types of visuals in your deck:
- Line Graph: Monthly Recurring Revenue (MRR)
- Bar Chart: LTV vs. CAC across three quarters
- Retention Curve: Monthly revenue retention by cohort
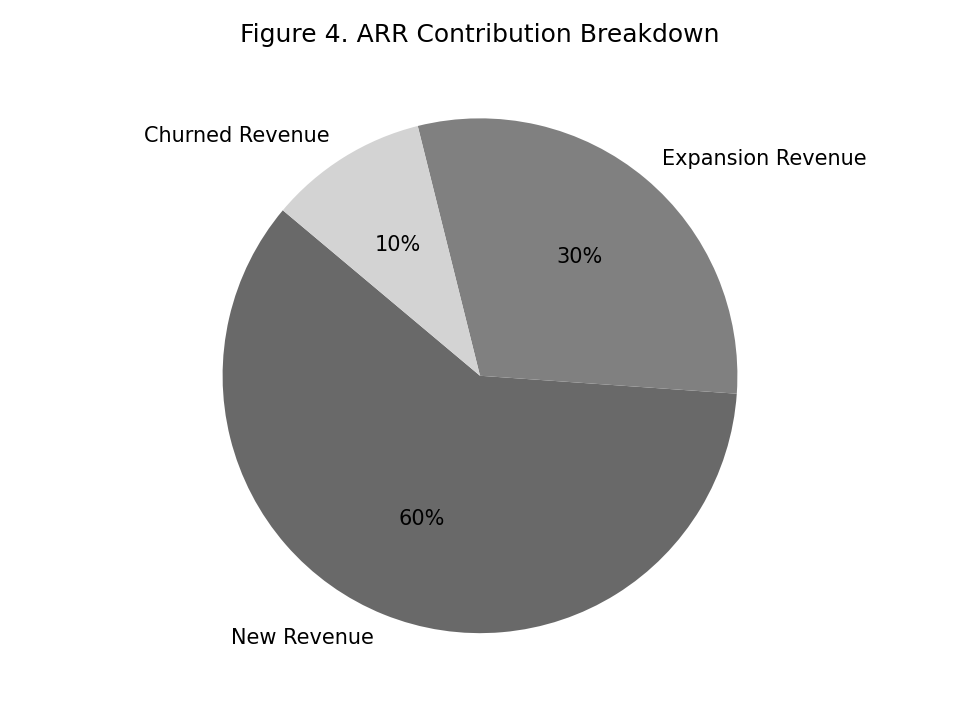
- Pie Chart: % contribution to ARR from new, expansion, churn
- Table: Burn multiple and efficiency metrics by quarter
Conclusion: Let Your Metrics Speak Loudly
When done right, turning your revenue metrics into a winning pitch means letting the strength of your business shine through the numbers. Investors want to be taught – show them how your startup is gaining traction, and educate them on why those metrics signal an unmissable opportunity.
If you need help analyzing your financials or crafting a compelling investor story, we’re here to help. Van Natter Consulting Group specializes in guiding early-stage startups through the complexities of financial modeling and investor communications.
Contact Van Natter Consulting Group today to elevate your investor pitch and drive your startup’s growth globally.
Ready to rise with confidence?
 Book a Free Strategy Call with Van Natter Consulting Group and build a revenue engine that fuels your next round and beyond.